Pure Swiss Air? It Depends On Your Benchmark…
May 2026
As with climate, air quality is an often overlooked but important consideration when assessing the “liveability” and/or investment potential of a given property. Amongst several pollutants of concern, fine particulate matter (PM2.5, i.e. airborne particles smaller than 2.5 micrometres) is often considered to carry the greatest public health burden, since it can penetrate deep into the lungs and enter the bloodstream.
Yet the standards used to define “acceptable” concentrations of PM2.5 vary. Switzerland’s legal limit is an annual mean of 10 µg/m³ [1]. Meanwhile, based on growing evidence that adverse health impacts can arise at lower concentrations, the World Health Organization (WHO) revised its own guideline down from 10 to just 5 µg/m³ in 2021 [2]. Crucially, according to the scientific consensus, there is no truly safe level of PM2.5 exposure, with measurable increases in mortality and cardiovascular and respiratory disease extending down to very low concentrations.
For example, a major European study of over 28 million participants across seven countries, including Switzerland, found significant associations between long-term PM2.5 exposure and non-accidental mortality that persisted below 10 µg/m³ [3] – a finding echoed in the global epidemiological literature [4]. The gap between the Swiss legal limit and the WHO guideline must therefore be considered a policy choice, reflecting what is deemed politically and economically feasible, rather than one grounded purely in the latest scientific evidence.
Here, we present an analysis based on air quality data compiled by SwissClimmo at all address locations nationwide. We focus on annual mean PM2.5 concentrations from 2015 to 2024 across six varied Cantons: Basel-Stadt (BS), Geneva (GE), Zürich (ZH), Graubünden (GR), Ticino (TI), and Valais (VS). Together, these six cantons contain over one million addresses, with mean address densities ranging from 18/km² (GR) to 866/km² (BS).
Average PM2.5 concentrations in these cantons have decreased modestly but fairly consistently over the decade (Figure 1). A clear split emerges between the more urban cantons (BS, GE, and ZH) with higher concentrations, and the more mountainous / rural cantons (VS, GR) with noticeably lower concentrations. Despite having a relatively low average address density of just 70/km², Ticino also sits firmly in the “urban” group. Being situated on the southern side of the Alps, the region is directly exposed to the Po Valley – one of Europe’s most persistently polluted airsheds [5] – and has topography which channels and traps air masses, amplifying concentrations in its denser, lower-elevation urban areas.
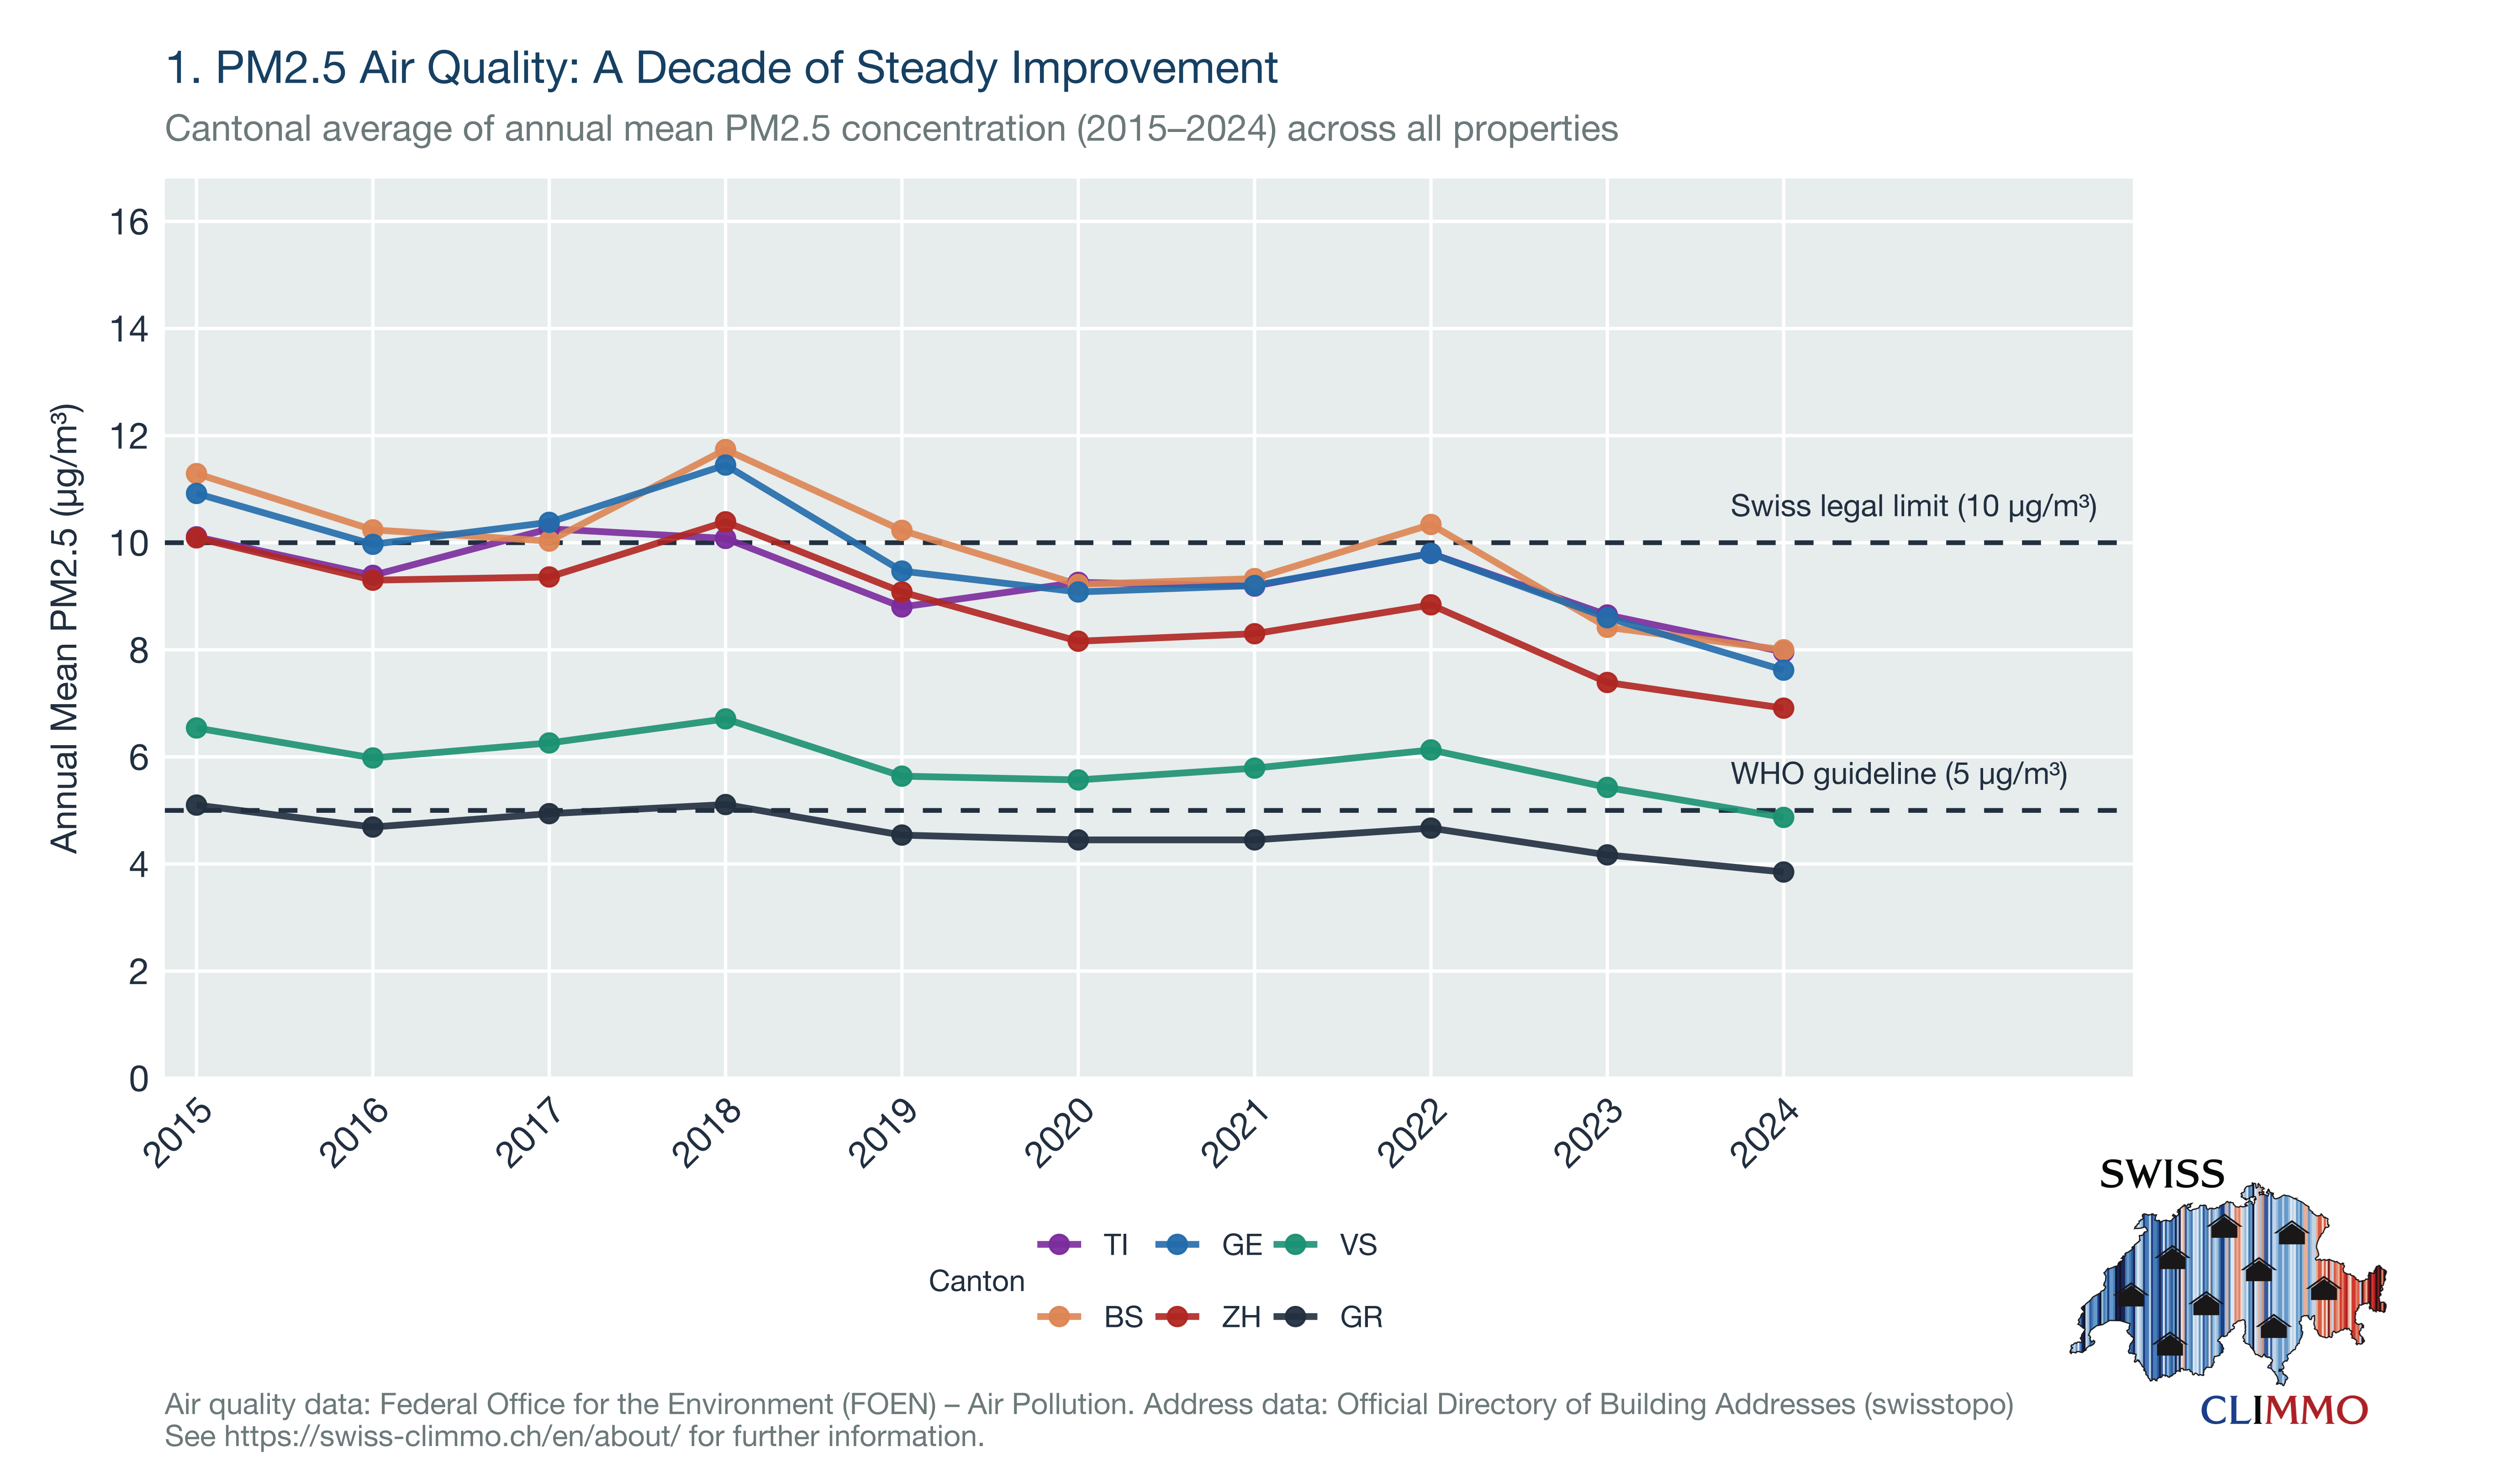
Overall, the “good news” story is that by 2024, canton-wide average annual PM2.5 concentrations were within the Swiss legal limit of 10 µg/m³ in each of the selected cantons. However, these average values provide no indication of the underlying (spatial) distribution of pollution levels across properties, and therefore no information about the number of addresses breaching either the Swiss legal limit or the WHO guideline.
We therefore consider next the percentage of properties in each canton exceeding these thresholds (Figure 2), with striking findings. In the predominantly urban cantons (BS, GE, and ZH), the percentage of addresses exceeding the Swiss legal limit of 10 µg/m³ had fallen to practically zero by the most recent years – a picture of apparent compliance. Yet in the same cantons, virtually 100% of addresses continue to exceed the WHO guideline of 5 µg/m³ throughout the entire period, with no meaningful downward trend in evidence. Ultimately, different thresholds applied to the same data produce highly opposing narratives about the quality of the air that the population breathes.
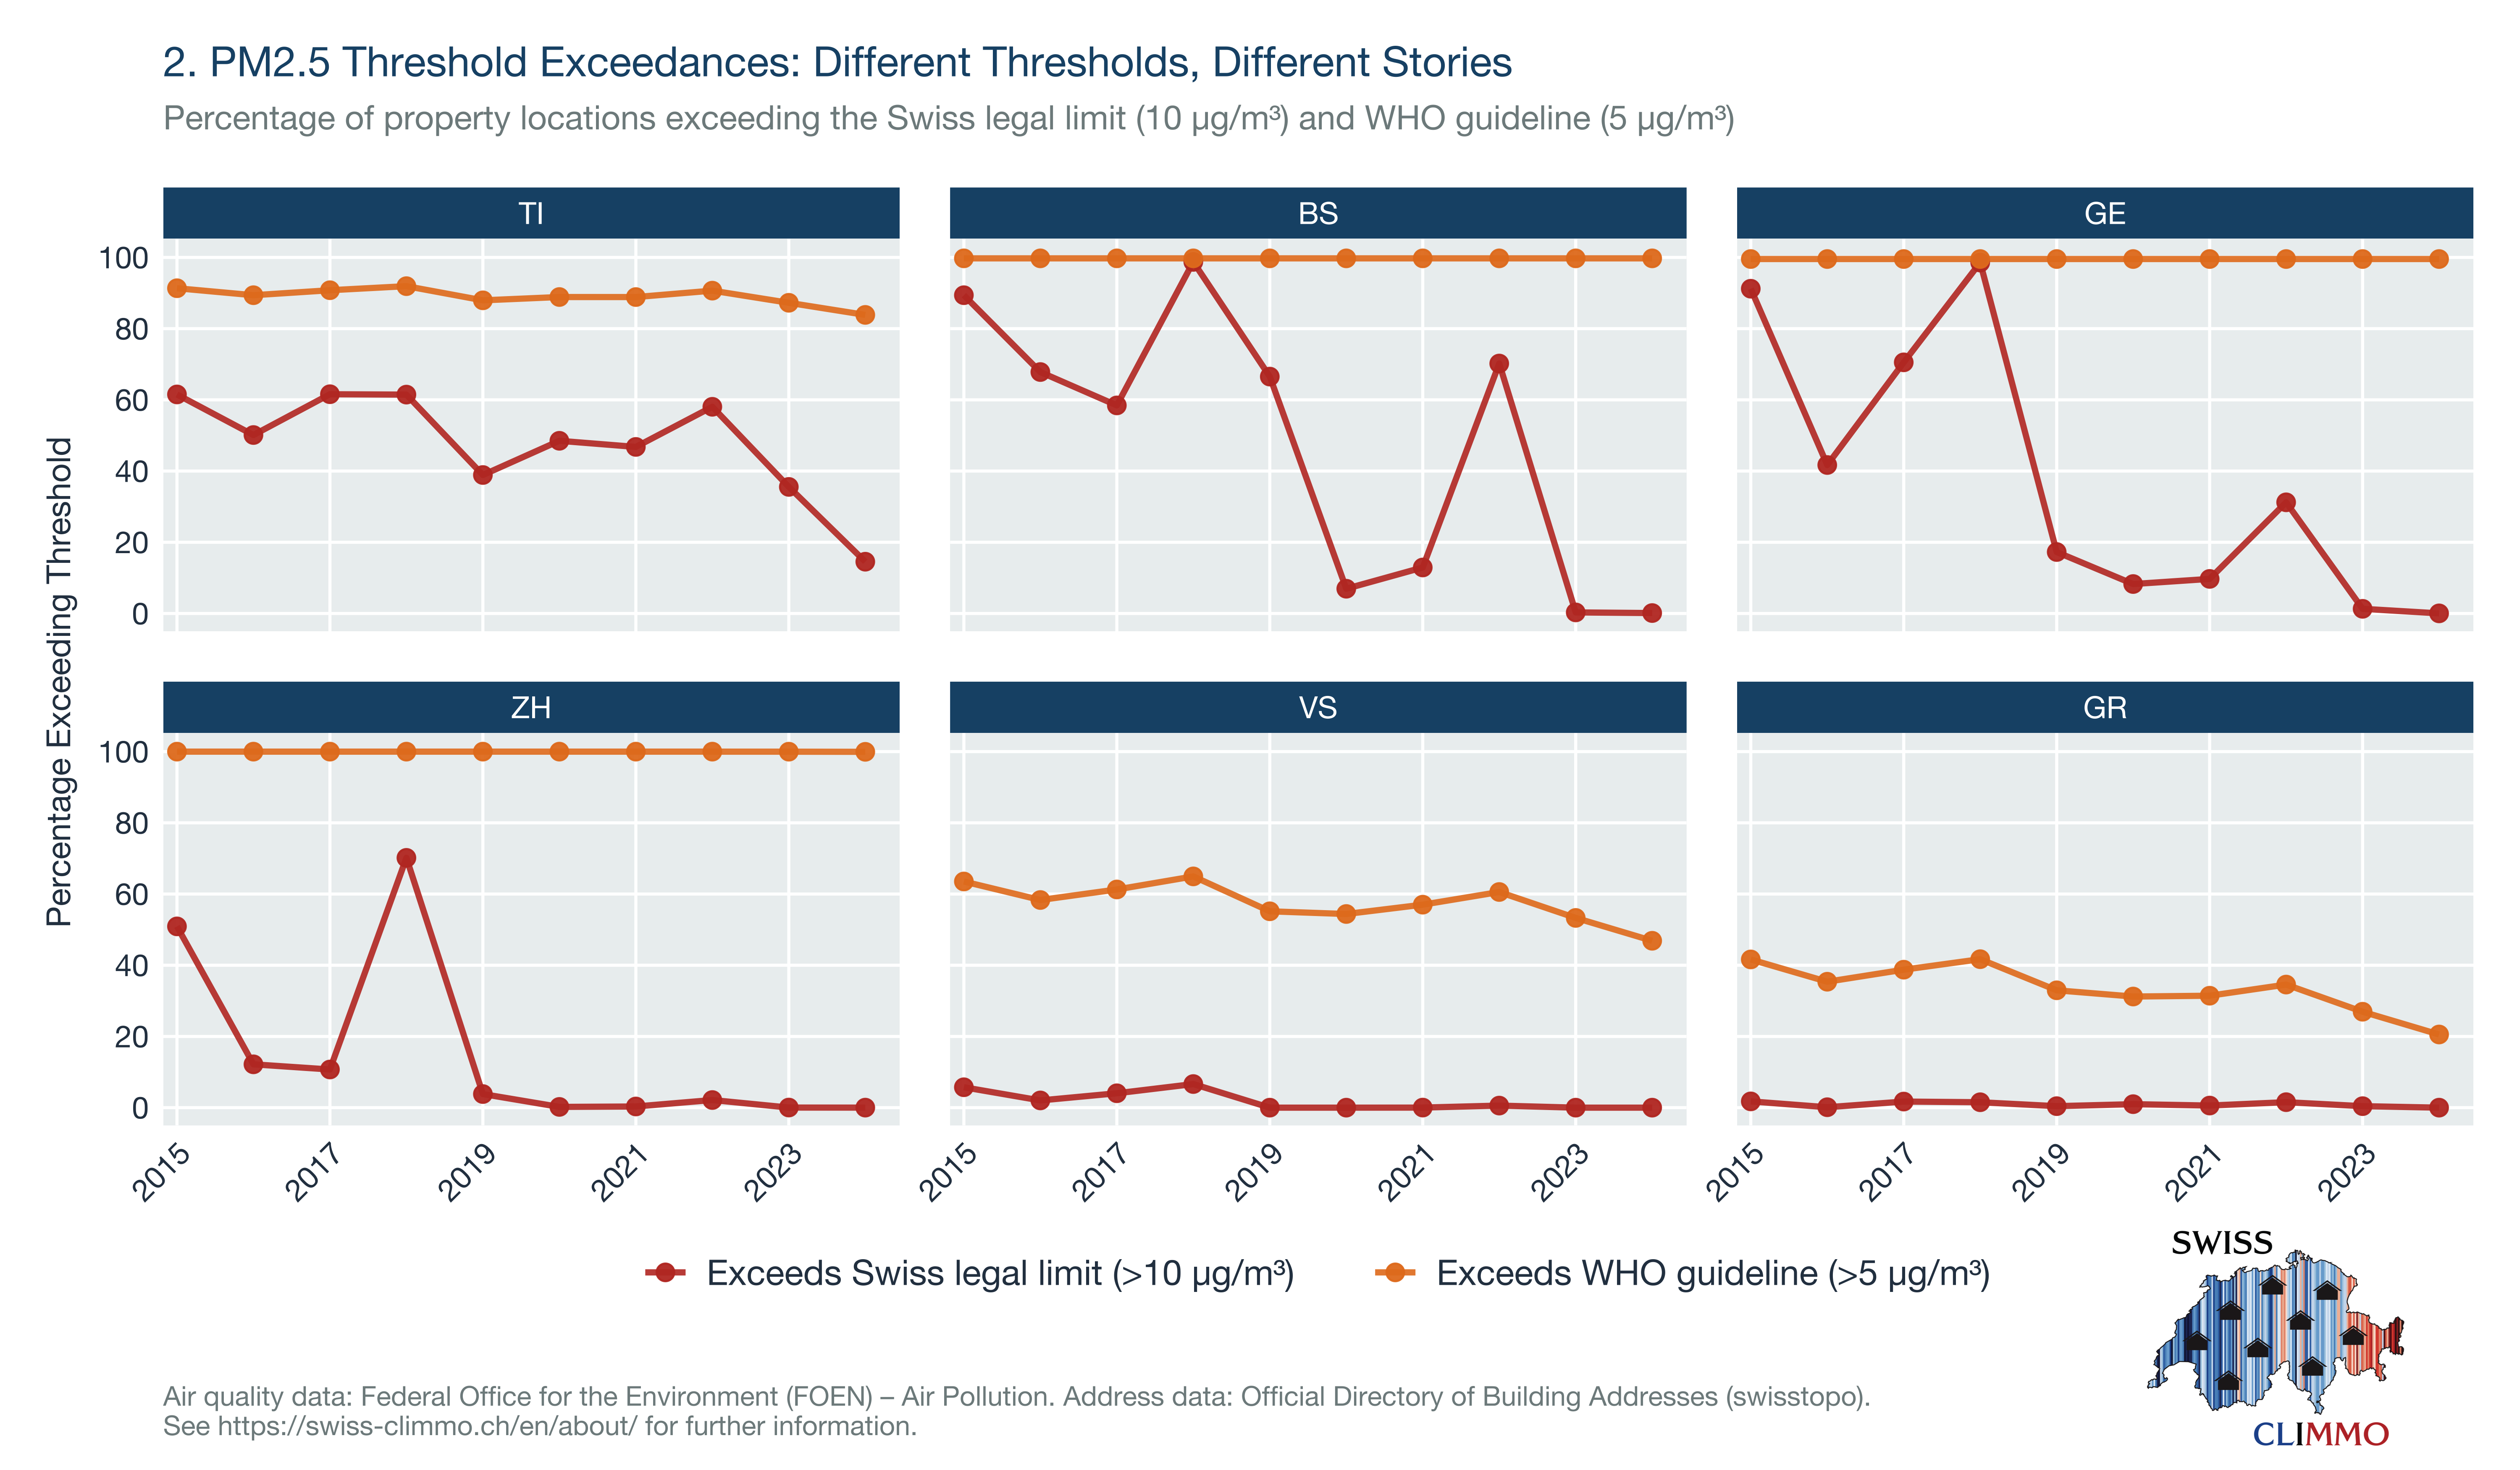
Against this somewhat discouraging backdrop, GR and VS stand out as relative bright – or rather, clean – spots. By 2024, cantonal average annual PM2.5 concentrations in both cantons were below the WHO guideline, albeit only just in the case of VS (Figure 1), and the proportion of addresses exceeding it had declined substantially over the decade – to approximately 21% in GR and 47% in VS (Figure 2). While neither canton is uniformly satisfactory with respect to PM2.5, their evolution seems encouraging.
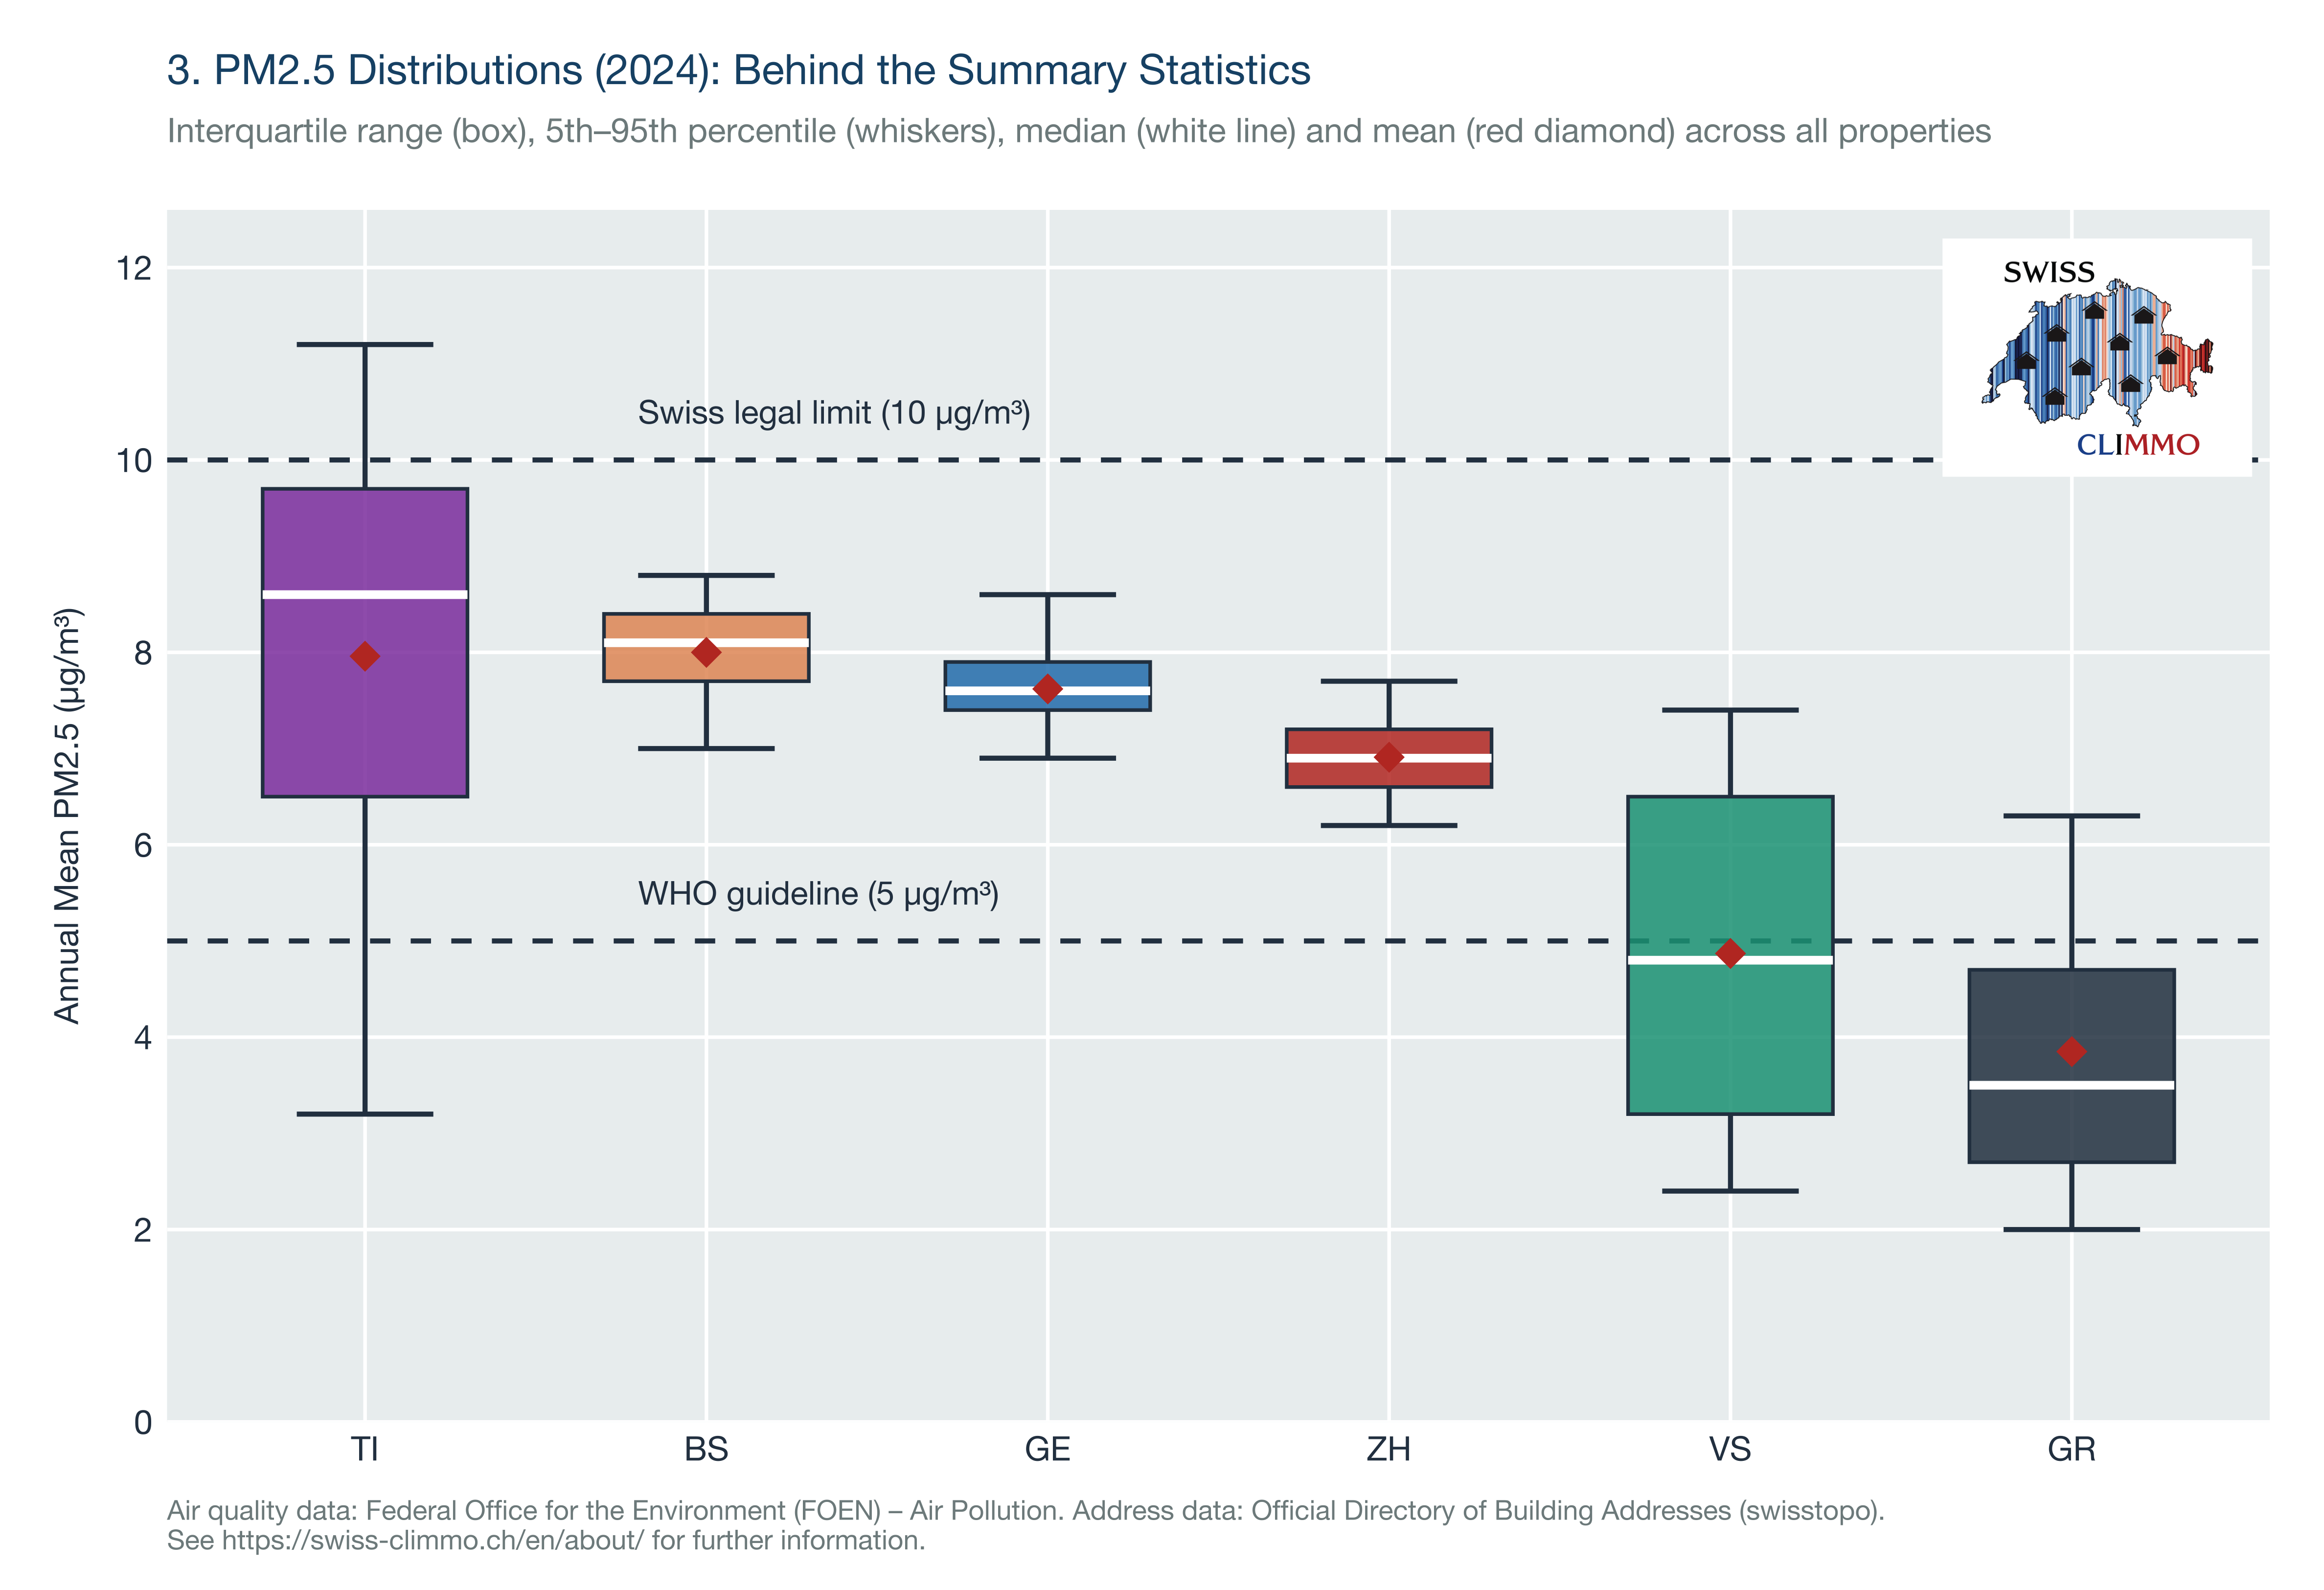
Finally, Figure 3 presents the full distribution of PM2.5 concentration across properties by canton for the most recent year in our analysis period, 2024. The more mountainous / rural cantons (TI, GR, and VS) are seen to exhibit particularly high variability, which is unsurprising given they contain both towns and cities as well as more remote, higher-elevation settlements. The distributions are much narrower in the predominantly urban cantons, which are smaller, flatter, and at lower elevations. As we have already seen, these distributions sit within a higher concentration range.
Faced with such spatial variability, highly localised data become indispensable. SwissClimmo’s Air Quality data package [6] provides not only PM2.5 concentrations, but also PM10, Sulphur Dioxide, Nitrogen Dioxide, and Ozone concentrations, for all properties nationwide. These products enable buyers, lenders, and other stakeholders to identify – and if they wish avoid – properties with the most elevated atmospheric pollutant concentrations.
Note: This analysis is based on annual mean concentrations which inherently smooth out shorter-term variability, including episodic pollution spikes that can also have significant health consequences. Reflecting the importance of this shorter-term variability, the WHO also sets a 24-hour average guideline of 15 µg/m³ for PM2.5 [2]. Assessing higher-frequency data against the 24-hour threshold would also be extremely informative; however, the necessary high-resolution gridded data are not currently available.
References
[1] Federal Office for the Environment (FOEN): https://www.bafu.admin.ch/en/fine-particles
[2] WHO Global Air Quality Guidelines 2021: https://www.who.int/publications/i/item/9789240034228
[3] Stafoggia et al. (2022): https://www.thelancet.com/journals/lanplh/article/PIIS2542-5196(21)00277-1/fulltext
[4] Burnett et al. (2018): https://doi.org/10.1073/pnas.1803222115
[5] Copernicus Atmosphere Monitoring Service (2024): https://atmosphere.copernicus.eu/extreme-episode-particulate-matter-air-pollution-across-italys-po-valley
[6] SwissClimmo: https://swiss-climmo.ch/en/products/